Image: Glenn Landberg
Holding the fabric together Workforce
Holding the fabric together
On Thank You Day last year, Virginia Trioli summed up the work of the community sector this way:
“This pandemic has exposed so many cracks and frailties in our social fabric. But the work that you do, in many respects through this pandemic has been the only thing holding that whole fabric together.”
2020 could be politely described as a challenging year for community service organsations (CSOs), what with holding the fabric of society together.
And as we move into a recovery phase that’s presenting whole new challenges to some of the most vulnerable cohorts of Victorians, workers in this vital, connective sector need all the support they can get – all the support you can get.
But in an industry often defined by short-term contracts and a necessarily mobile workforce, sometimes the challenge is being counted – literally, quantitatively – to know where and how much and what kind of support is needed.
In the rush of providing necessary frontline services there hasn’t been much surplus capacity for data gathering in the last hectic year. What does the sector currently look like, how big is it and where is it expanding, where are its pressure points?
Data provided by Victorian charities to the Australian Charities and Not-for-profits Commission gives a snapshot of how the sector grew between 2015 and 2018, and we can use those trends to infer community sector needs on the other side of the traumatic year that was 2020.
The first and most obvious headline from the data is that the sector was growing by a rate of knots: approximately 27 per cent growth between 2015 and 2018, with a total income of around $19 billion, up from 14.
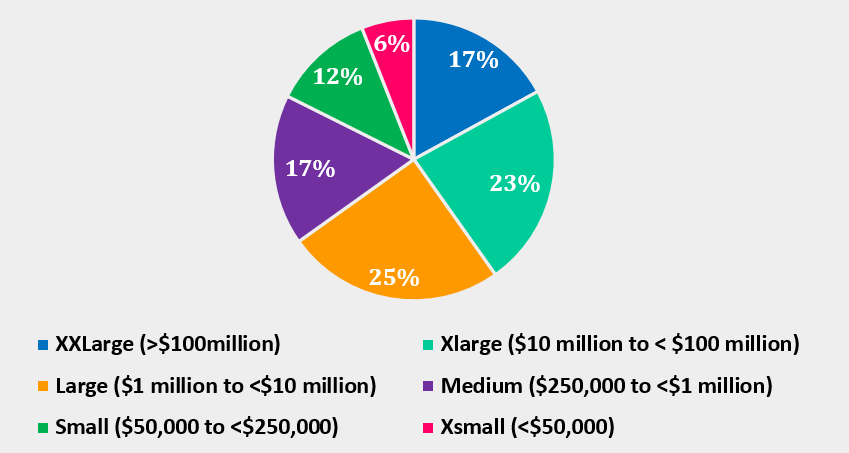
Of the organisations that self-reported in 2018, the majority (53 per cent) were small – defined as those with an annual income of less than $250,000 – or extra-small – less than $50,000.
Community service organisations by size |
|
| Extra extra-large (>$100 million) | 31 |
| Extra-large ($10 million – $100 million) | 256 |
| Large ($1 million – $10 million) | 825 |
| Medium ($250,000 – $1 million) | 838 |
| Small ($50,000 – $250,000) | 968 |
| Extra-small (<$50,000) | 1190 |
Nearly a third of organisations had revenue of less than $50,000, and these smaller organisations received more of their income from fundraising and donations.
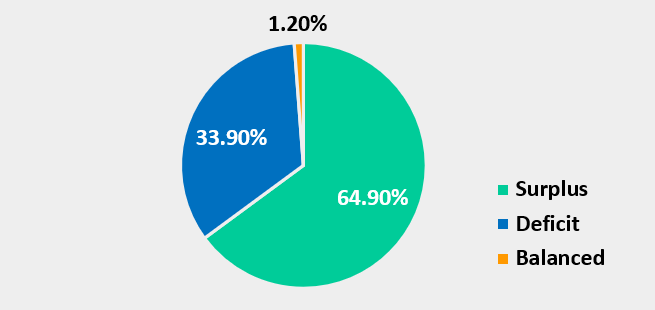
Over 40 per cent of them reported a budget deficit in 2018.
The sector employed more than 185,000 people in 2018, representing around 5 per cent of the state’s workforce, and was projected to be one of the fastest growing Australian industries, significantly outstripping fields like construction, manufacturing and financial services.
Percentage jobs growth by industry (2019-2024), Australia
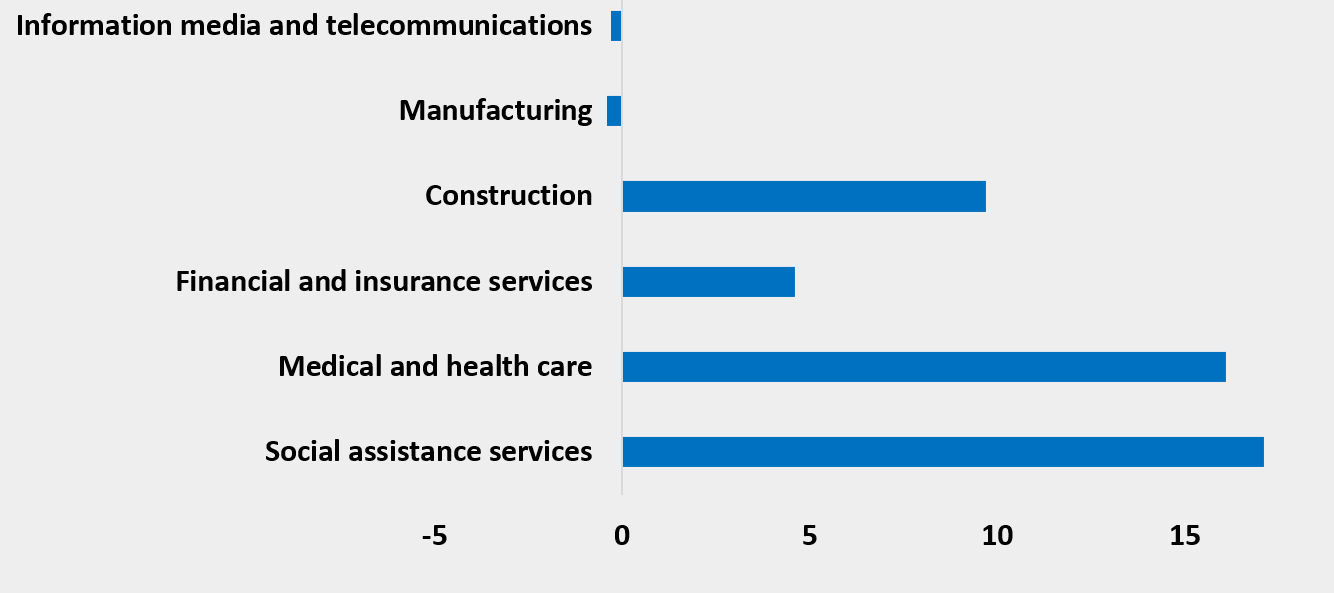
The community sector was heavily reliant on part-time workers – around 44 per cent – and on casual employment with around 23 per cent of roles.
Number of paid workers in community service organisations 2018
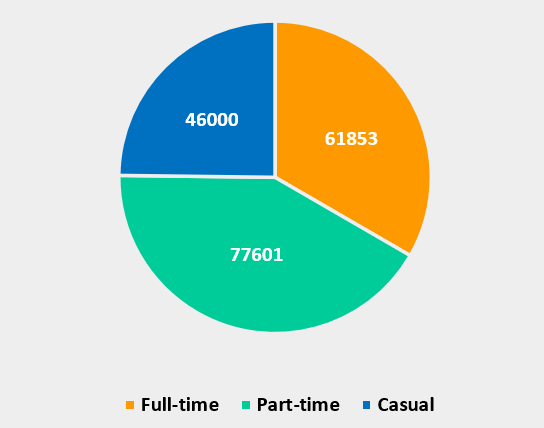
Pie graph showing 61853 full-time workers, 77601 part-time workers and 46000 casual workers.
And, not surprisingly, the data shows how much the sector relied on volunteers: about 430,000 of them in 2018, across organisations large and small.
Number of volunteers by charity size
Already from this snapshot some likely sector pressure points in the post-COVID world are pretty clear.
The majority of volunteering activities dried up during the pandemic – because of lockdowns, and because many volunteers are in high-risk categories for the virus.
Women – who make up the bulk of casual and part-time workers – have been hit particularly hard by the recession, and by increased caring responsibilities associated with remote learning.
Many organisations’ income sources will have dried up, with lockdowns limiting opportunities for fundraising and community financial strain reducing people’s ability to donate.
This is particularly worrying for smaller organisations, which were more reliant on fundraising and donations, and were also more likely to report a budget deficit. But even organisations receiving more government grants are likely to be feeling the pinch, since funding was not keeping up with the true costs of delivering services even before the pandemic hit, and community demand and complexity of need has only increased.
Budget position of community service organisations, 2018
Data is the new deity in our information-rich world. The data available here is useful: it can illuminate big-picture trends and vulnerabilities, help us prioritise our efforts.
But data is also just a congregate of individual stories, and looking around in 2021, hearing the stories emerging from our sector, the data is really a confirmation of what we already know.
We know that CSOs have been vital in helping to hold their communities together, sometimes running on the smell of an oily rag.
We know that staff, particularly in fire-affected areas in the aftermath of the 2019-20 bushfires, have worked through personal trauma and risked burnout.
The data tells us that the community sector is a vital and expanding part of the Victorian economy, but that we should be worried about the sustainability and the very survival of some organisations, particularly small and very small ones.
Individual stories tell us how necessary these organisations are, how much their loss would compound community suffering.
Both the data and everything we’ve seen before and during the pandemic tell us that CSOs need stable, reliable, ongoing funding, indexed to cover the true costs of doing business and to keep up with community needs.
Because thanks are not enough to hold the fabric together.